Remote Sensing Platforms
The previous chapter focused on some of the physical foundations in remote sensing, this chapter provides an overview of some of the common groups of remote sensing platforms that are available for collecting imagery as well as some of the basic image processing routines to begin working with imagery that is acquired by such systems. This unit will conclude by reviewing some of common image band ratios and transformations that are commonly used with some of the remotely sensed imagery.
The different commonly used remote sensing systems can be divided into two categories, airborne and spaceborne. As can be seen in these lists, airborne systems include a wide range of sensors such as:
The different commonly used remote sensing systems can be divided into two categories, airborne and spaceborne. As can be seen in these lists, airborne systems include a wide range of sensors such as:
- Panchromatic – which is black and white imagery.
- True color imagery – which us humans are most familiar with
- Color infrared – which typically includes the true color bands plus one color infrared band
- Digital Orthophotos – which is typically true color imagery, but has had substantial extra processing to remove various geometric anomalies such as building tilt, the geographic position of features based on changes in elevation. Digital orthophotos have also been processed to have a high quality spatial reference applied to it, which most end-users desire and expect.
- Multispectral – multispectral imagery is an extension of the color infrared imagery in that this imagery will typically have multiple color infrared wavelengths being collected on the sensor and/or there are some extra color wavelengths such as “Red Edge” which is a wavelength range that exists between the “red” and “infrared” part of the electromagnetic spectrum. In recent times, scientists have shown that this “red edge” band has some special spectral benefit to vegetation analysis applications.
- RADAR – a RADAR sensor is one that collects image data based on radio waves. RADAR sensors typically have some special ability to provide information on vegetation structure, ice, and water properties.
- LiDAR – a LiDAR sensor is one that collects image data based on emitting a laser beam. LiDAR sensors collect high resolution elevation data that can be useful to generate digital elevation models and to create 3D representations of objects such as buildings and tree structures.
Hyperspectral – these sensors typically collect spectral information in “hundreds” of bands versus only a few (that is, 3 or 4) that are commonly found in true color or color infrared imagery.

|

|
These two images above are examples of “orthophotography”. The image on the left, although is considered and orthophoto, it is not a “true” orthophoto. The image on the right shows an example of a “true” orthophoto. Notice that the buildings in the image do not have any tilt in them.
|

|
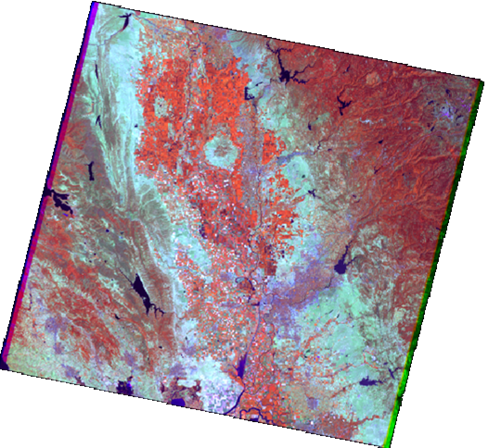
This images above shows two examples of optical satellite imagery. The term “optical” is used since many satellites use optics to resolve features on the ground.
The image on the left is of a typical Landsat Themetic Mapper image of the Central Valley in California. Sacramento can be found in the lower right quadrant of the image. The image on the right is of the QuickBird satellite, which has a 2ft resolution and is the highest resolution commercially available satellite.
Notice in this image of the Port of Abu Dhabi in the United Arab Emirates the individual cargo containers, buildings, and cargo cranes.
|

|
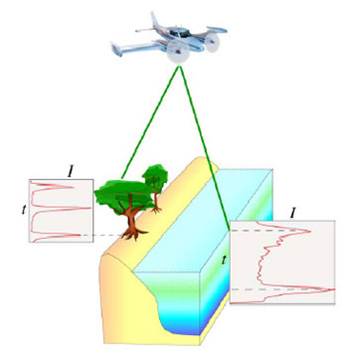
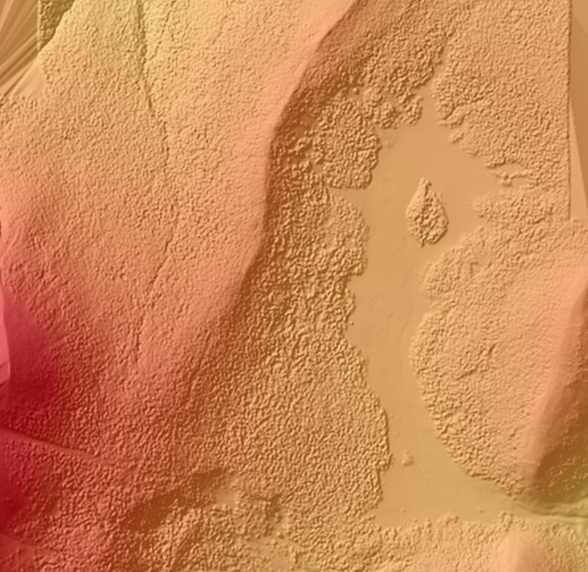
The image on the left shows an illustration of how LiDAR operates. Usually an airplane carrying a LiDAR sensor shoots a laser beam at a high pulse rate. The light beam then hits an object on the ground and the light wave is then returned to the sensor. LiDAR is used to record highly accurate elevation data and is capable of collecting the structure of objects such as trees and buildings. The image on the right is a LiDAR image of a volcano. Notice the intricate details of erosion, the volcanic cone, and rippling mud flows.
|
|
Here are more examples of LiDAR data. The upper left image shows a digital surface model for a portion of the Philmont Boy Scout Ranch in New Mexico. The elevation data has been draped over a hillshade layer. The small bumps in the data are actually the tops of individual shrubs. The hillshade is a derivative layer that can be created from the elevation data. A hillshade is a data layer that models shadows as if the sun were shining from a particular angle on the horizon. The hillshade layer can be used to create the appearance of a 3D effect when viewing LiDAR or other digital elevation data.
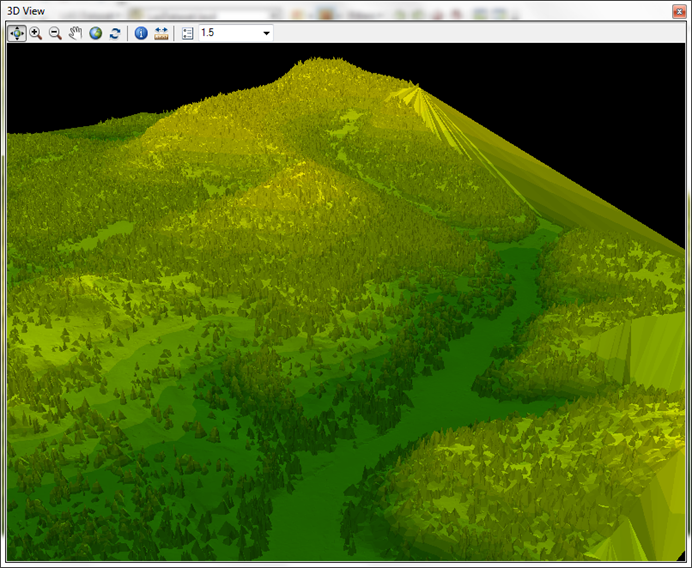
The image on the upper right is an example of a 3D perspective view of elevation data. The elevation data is essentially being viewed from a different vantage point than just straight down. Again, the individual shrubs can be modeled. This view has been exaggerated to enhance the appearance of elevated terrain.
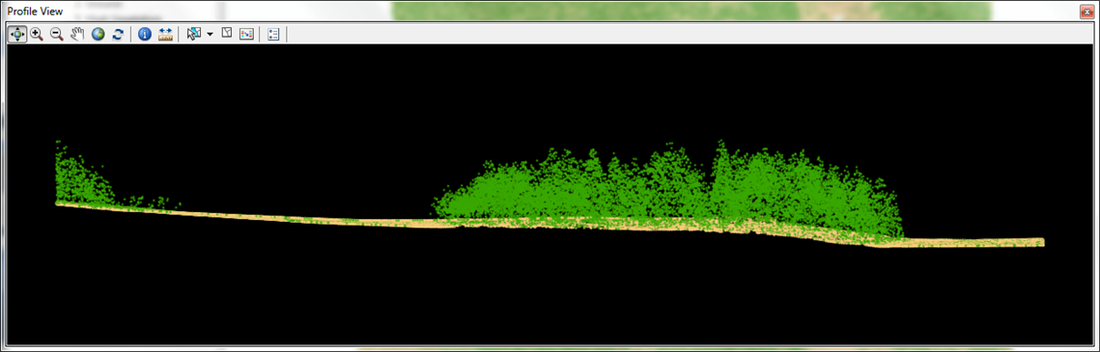
The bottom image shows a profile view of a small section of the upper right image. Within the current version of ArcGIS (10.1 or greater), raw LiDAR data can be viewed with a profile tool. This tool allows for the viewing and editing of LiDAR data while working in ArcMap. This is a recent enhancement that has made raw LiDAR data more useful than with using older versions of ArcGIS.
The image on the upper right is an example of a 3D perspective view of elevation data. The elevation data is essentially being viewed from a different vantage point than just straight down. Again, the individual shrubs can be modeled. This view has been exaggerated to enhance the appearance of elevated terrain.
The bottom image shows a profile view of a small section of the upper right image. Within the current version of ArcGIS (10.1 or greater), raw LiDAR data can be viewed with a profile tool. This tool allows for the viewing and editing of LiDAR data while working in ArcMap. This is a recent enhancement that has made raw LiDAR data more useful than with using older versions of ArcGIS.
|
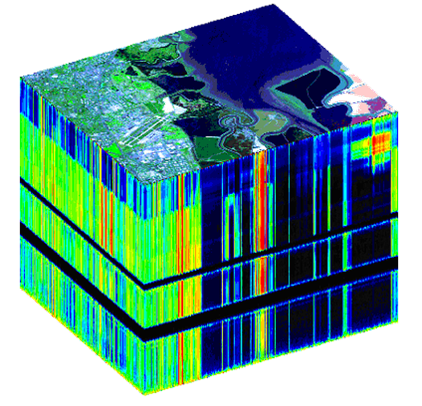
The image on the left shows a “hyperspectral cube” which is a graphic rendition that shows the dimensional of hyperspectral data. The black “bands” across the bottom of the imagery indicate parts of the electromagnetic spectrum where energy from the sun is absorbed by water vapor or atmospheric gases. In addition to these three hyperspectral sensors there are a number of private commercial companies that have started to develop, deploy, collect, and process hyperspectral data for clients. Some of these are related to mining, and monitoring the illegal cultivation of plants used in controlled substances. There are currently three popular hyperspectral sensors that are used today. AVIRIS (Airborne Visual/Infrared Imaging Spectrometer), Hyperion, which is a hyperspectral satellite, and Proba-1 which is a satellite that contains the CHRIS hyperspectral instrument All of these capture imagery in dozens or hundreds of wavelengths (or bands) vs only a few that you have seen in aerial or satellite multi-spectral systems. The picture here in the middle shows an example of the Hyperion satellite image that captured an active fire in Tuscon, AZ. |
