2.3 Types of Geospatial Data Models
|
Vector Data Models
This section will discuss one of the three geospatial data models available to use in a GIS. A vector data model defines discrete objects. Examples of discrete objects are fire hydrants, roads, ponds, rivers, or buildings to name a few. A vector data models can be broken down into three basic types: points, lines, and polygons (sometimes called area). All three of these types of vector data are composed of an object or set of objects, coordinates, and attributes. A vector point uses a single coordinate pair to define its location. Points are considered to have no dimension even though they may have a real world dimension. For the purposes of a GIS, no dimension is assumed. Each point has associated attribute information, and the information is attached to the center of the point. Examples of spatial phenomenon that would be modeled well as points are light poles, manhole covers, and crime locations. What you see on this screen are the different ways to represent airports using a point vector type. Even though the symbols are different, they all represent airports, and, all of the attributes for each airport are linked to the center of each one of these symbols. |

|
|
A vector line is defined by an ordered set of vector points connected to each other. There are two words that we need to define when discussing lines: the node, and a vertex. A node is where a line begins or ends. A vertex is where a line changes direction. The smallest possible line will have two nodes, a start node, and an end node. Longer lines will have at least two nodes, and many vertices in between where the line changes direction. Attributes may be attached to the entire line, individual node, or individual vertices, therefore, each line may have multiple rows of attributes in the attribute table. For example, if a line represents a road, each road segment between two intersections may have its own address information, such as the start address, and the end address for that block. An intersection may have an attribute that describes where the intersection has a stop sign, or stoplight. The other option, is for the entire line to have one row of attributes no matter how complex the line. Examples of spatial phenomenon that are modeled well by lines are roads, pipelines, outlines of objects, and power lines. |
|
|
The last vector data type is the polygon. A polygon, also called an area, is formed by a set of connected lines where the start and end a point have the same coordinate. As the start and point have the same coordinate, the polygon will close and will have an interior region. Attribute information is attached to the center of the polygon no matter how complex the polygon. Examples of spatial phenomenon modeled well by polygons are lakes, cities, tree stands, and political boundaries. |

|
Raster Data Models
The raster data model best represents continuous objects such as temperature or elevation; which is a regular set of cells, or pixels in the case of a photograph, in a grid pattern, also referred to as a matrix. Each cell in the raster contains a single value, and the coordinate of each cell of the raster refers to the center of the cell. Therefore, the single value stored in each cell of the raster, applies to the entire cell in the raster matrix. Each cell can be defined by a cell dimension such as the cell width and height. Often, cells in a raster or square, so the cell with a cell height will be the same.
The raster data model best represents continuous objects such as temperature or elevation; which is a regular set of cells, or pixels in the case of a photograph, in a grid pattern, also referred to as a matrix. Each cell in the raster contains a single value, and the coordinate of each cell of the raster refers to the center of the cell. Therefore, the single value stored in each cell of the raster, applies to the entire cell in the raster matrix. Each cell can be defined by a cell dimension such as the cell width and height. Often, cells in a raster or square, so the cell with a cell height will be the same.
|
This is an example of a raster. In this case the raster is an aerial photograph showing a portion of the port of Corpus Christi, Texas. Photographs are the most common data sets that are represented by rasters. In fact, the photos that you take with your camera, or camera phone, are stored in a raster format. So for instance, a JPEG, is a raster file stored in the JPEG format. In these pictures, each cell contains a single value that represents the color reflected from the objects.
In GIS, it is important that we know the resolution of the raster. Raster resolution is the cell, or pixel, size of each cell of the raster. Unlike how photographers represent resolution, as the number of megapixels their camera uses, in GIS, we are not as concerned about the number of cells, but of how much area on the ground each cell covers. There is a direct trade-off between resolution and file size; the higher the resolution, the smaller area the pixel represents, the higher the file size. The coordinate of each cell is the center of the point cell, and the coordinate applies to the entire cell area. |

|
|
Again, it is important to reiterate that each raster cell represents a specific area and the value assigned applies to the entire cell area. If there is more than one value, they can fall inside the raster cell, then the raster cell may contain the average, central, most common, or only value covered by the cell.
For instance, let’s revisit the picture of the port of Corpus Christi, Texas. If we zoom in to the ship, we will be able to see each individual cell. You can now clearly see that each cell only contains a single color. Here zoomed into the raster image, you can see that the resolution is not infinite, and each cell covers a large location on the ground. Additionally, we know that each cell can only contain a single value, but on the ground multiple colors were reflected. So in this case, the camera have the choice of taking the average color, most common color, or a single color for the cell. When this happens, data is lost through aggregation, and it is important to keep that limitation in mind. While we would like to have a much higher resolution photo of the ship, this would be practically expensive, and would produce an outrageously large file size, so the trade-off was coverage of a larger area, but at a lower resolution. |

|
|
In addition to colors, a raster can store other data values. For instance, this raster contains a single character and each cell, where each character represents grass, road, or water. Again, we can guess that each cell doesn’t contain exactly water, a road, or grass, so we assume that some aggregation has taken place again. But in either case, this raster can store information about the continuous phenomenon, in this case land cover, in a meaningful way.
If we apply colors to the previous Grass, Road, and Water values, we can visualize the data like this. This this visualization shows what is covering the earth in each cell of the raster and allows us to simplify our vision of reality to see patterns. |

|
|
Triangulated Irregular Network (TIN) Models
A triangulated irregular network (TIN), is a network of triangles connected together to create a 3-D surface. TINs are more complex than rasters, however they are more efficient in terms of file size. Additionally, triangular irregular networks can easily accommodate different sampling densities, where rasters cannot. If we look at the anatomy of a TIN, is composed of points, edges, and faces. A point represents an input data value that is preserved, and defines an endpoint for a triangle. The edge, is the line drawn between each point which creates the outline of the triangles. The face is the area, or surface, inside each of the triangles. |

|
|
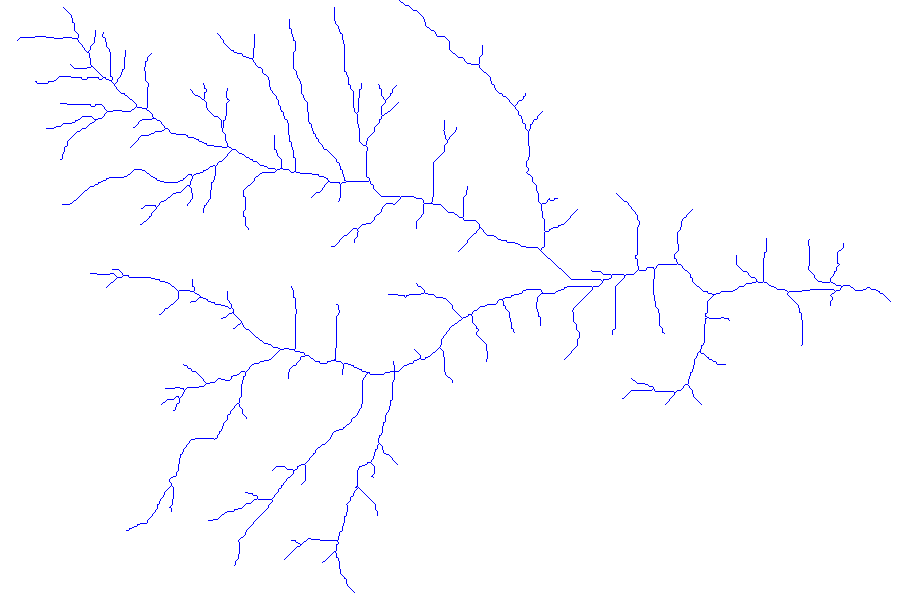
TINs can be quite large or small in area size and look quite complex. However, if you think about what each point of the triangle represents, in this case, an elevation point, and you know that faces are the flat face of a triangle, you can decipher some of the features in a TIN without seeing it colorized. For instance, the very large triangles in the top left corner of this trying to the irregular network represents a lake behind the dam. The very dense triangles flowing from the top right of the triangulated irregular network to the bottom right of triangular irregular network represents a river.
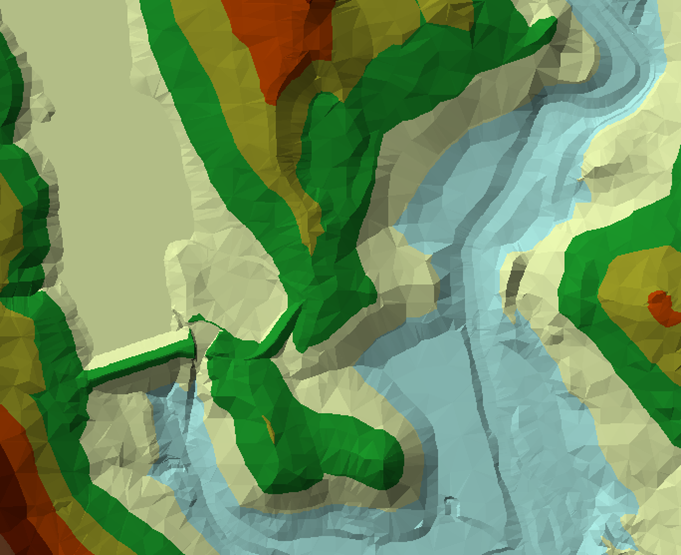
When we apply colors to this triangular irregular network based on the elevation value, it becomes clearer what the triangulated irregular network is representing. It is representing the continuous spatial phenomenon known as elevation. And in this particular case, shows a lake behind the dam, the surrounding terrain, and the river leading away from the dam. |
|
