2.2 Electromagnetic Energy
|
The Physics of Energy
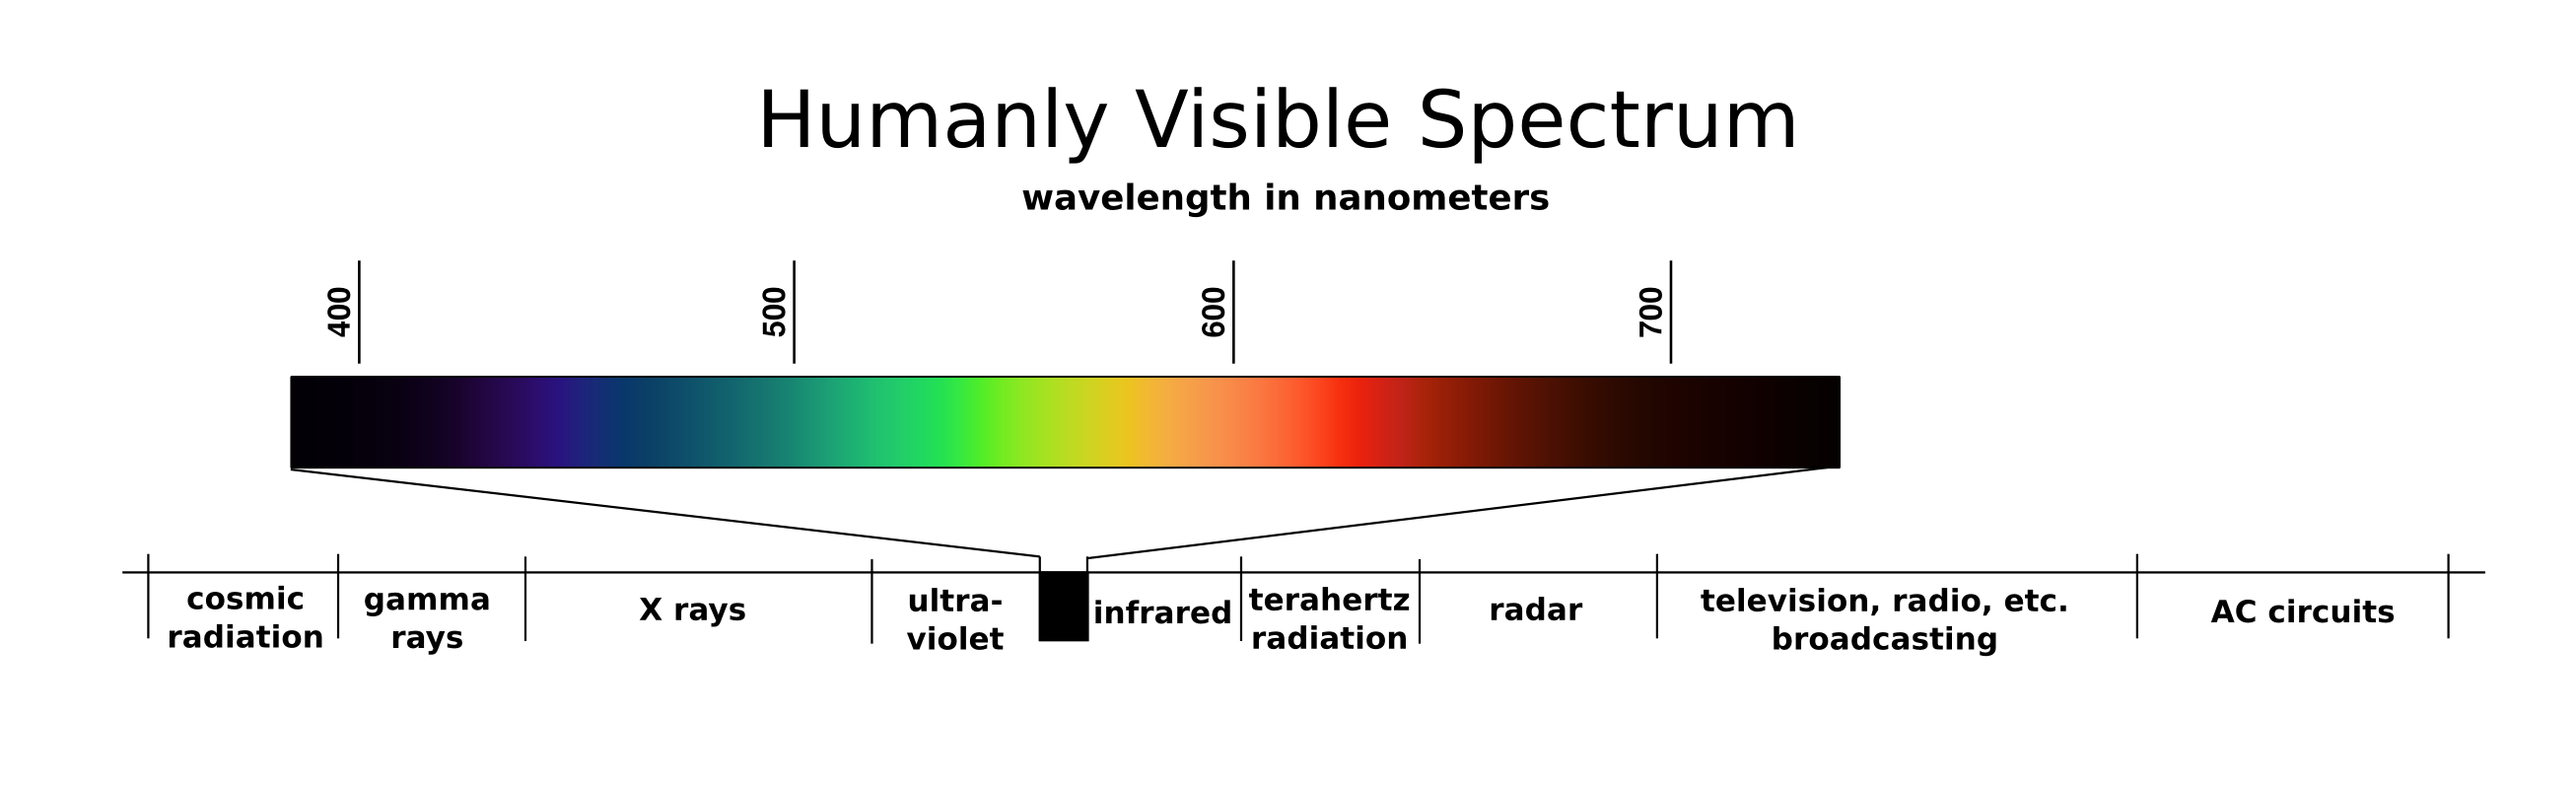
The main idea behind remote sensing is the recording of reflected electromagnetic radiation by sensors that are distant from the object being sensed. The electromagnetic energy is commonly referred to as light. Light energy is characterized by a wavelength and frequency and together defines a distinctive color. Let's get some more terms down. A wavelength is the distance between two wave crests (or two wave troughs); the higher the wavelength, the shorter the distance between two wave crests. Frequency is the number of oscillations (wave crest to wave crest) that completely passes a determined point within one second; the higher the frequency, the more oscillations per second. Together, a higher the energy means a higher wavelength and higher frequency for a particular wave. As humans, we see only the visible portion of the electromagnetic spectrum, which is composed of smaller and longer wavelengths that surround the visible section.. The full range of wavelengths is called the electromagnetic spectrum. |

Image Source: Wikipedia Commons
|
To provide a more thorough introduction to the electromagnetic spectrum, you’ll now watch three videos created by NASA. The first video will introduce you to the entire electromagnetic spectrum. The second video will discuss the visible portion of the electromagnetic spectrum which contains the colors that we see. The third video discusses infrared waves and their uses and remote sensing and science.
|
|
|
|
Let's briefly go over the measurement units used with measuring light. Short wave energy is usually measured in nanometers (nm), which is equal to one-billionth of a meter. The visible and long wave energies have lone longer wavelengths and are measured in micrometers (mm), which is equal one one-millionth of a meter.
The short wave spectrum consists of a short wave, high frequency energy such as gamma rays, x-rays, and ultraviolet radiation. Most of this energy is absorbed by the upper and mid-regions of the atmosphere. For examples, by the time UV radiation reaches the middle of the atmosphere, called the stratosphere, it is absorbed and reradiated by the ozone layer into a less dangerous energy type.
The portion of the spectrum that we can see with our eyes is the visible spectrum, which is roughly between 0.4 to 0.7 mm. This spectrum is usually broken down into smaller ranges of wavelengths called bands. The blue band ranges from 0.4 to 0.5 mm, the green band ranges from 0.5 to 0.6 mm, and the red band ranges from 0.6 to 0.7 mm. It is these three bands most commonly used in remote sensing to view the visible spectrum.
The infrared portion of the spectrum contains longer wavelengths than the color red, ranges between 0.7 to 100 micrometers, and is quite useful when studying environmental features such as vegetation. Like the visible spectrum, the infrared spectrum can also be broken down into smaller bands. The near infrared (NIR) ranges from 0.7 to 1.3 mm, the middle infrared (MIR) ranges from 1.3 to 3.0 mm, and thermal infrared (TIR) ranges from 3.0 to 14.0 mm. Generally, in GIS, and remote sensing, the visible and infrared portions of the electromagnetic spectrum are the most widely used portions of the spectrum.
It is important to understand aspects of the Sun and electromagnetic radiation because it is this reflected energy that makes up the electromagnetic spectrum that is recorded by remote sensors. Electromagnetic energy is all around us and is constantly striking objects. The energy is then reflected, absorbed, or transmitted from those objects back to our recording sensor, such as a camera. The energy that is reflected is what it appears as in the picture. In the visible spectrum, if an object reflects the color green, and absorbs all other colors in the visible spectrum, we will record the green wavelength for that object in our sensor. In addition to the energy being reflected from the visible portion of the electromagnetic spectrum, it is also simultaneously reflecting, absorbing, or transmitting electromagnetic energy outside the visible spectrum. We may, or may not, see the electromagnetic energy outside the visible spectrum based on which portion of the spectrum the sensor is calibrated see.

|

|
We will now look at an example of an image taken of a farm in South Texas. The image on the left represents the visible portion of the electromagnetic spectrum, and therefore, the healthy vegetation shows as green. Based on what we can see in the visible spectrum, the crops look perfectly healthy. However, let’s now take a look at the same crop but focusing on the infrared portion of the electromagnetic spectrum. The image on the right shows a different story of the crop area in the electromagnetic spectrum, healthy vegetation reflects a large amount of infrared energy. In the infrared spectrum, the dark red areas are where the crops are healthier. However, in the lower left portion the red looks lighter, indicating that the crops in this area are less healthy because of unusually high salt content in that portion of the farm.
This kind of imagery analysis is used not only for agriculture, but in determining the health of forestry such as disease or bug infestation and in drought monitoring. It is also used to monitor potential famine situations like in the Horn of Africa. One such agency is the Famine Early Warning System (FEWS NET).
This kind of imagery analysis is used not only for agriculture, but in determining the health of forestry such as disease or bug infestation and in drought monitoring. It is also used to monitor potential famine situations like in the Horn of Africa. One such agency is the Famine Early Warning System (FEWS NET).
