2.1 Geospatial Data Models
A geospatial data model is a formal means of representing spatially referenced information. It is a simplified view of physical entities and a conceptualization of reality. What I mean by "simplified conceptualization of reality" is that while we would like to store a complete model of reality, we really can't do that as it is not possible to represent every possible variable that exists in reality. For instance, if we want to represent a road in a geospatial data model, we would probably store the pavement type, number of lanes, and speed limit. We would not be able to store the amount of wear on the road based on friction with all of the tires that have traveled the road, nor would we necessarily want to. For our conceptualization of reality, we only store the information that is important for our task.

|

|
A geospatial data model is composed of two parts, objects and attributes, which combined together form a simplified model of reality. The object stores the geometry or shape of the spatial phenomenon that we are modeling. The attribute stores the descriptive information related to the object part of the geospatial data model.
|
As an example, here's a satellite view of the lower 48 States of yet United States of America. Let's assume that this satellite picture represents reality. So the question is: "How can we simplify and conceptualize this picture of reality for our purpose?" What if we want to conceptualize the USA as a basic reference map that only shows the boundary of the United States of America, State boundaries, water features, and major roads? We are going to represent our chosen model of reality using a geospatial data model. Once we have the data in the geospatial data models, we are then going to apply some good map design principles to arrive at a map that looks like what we would expect. |

|
|
This is a general reference map of the United States of America. What we see on this map is our simplified view of reality. We see the national outline, state outlines, water features, roads, and even elevation information. Note that while we are representing roads, we chose only to represent major roads and are leaving off all of the other roads for the purpose of readability.
By only showing major roads, we have simplified reality for our purposes. In fact, every facet of reality that we are displaying on this map has been simplified in at least one way. Now, if we're going to simplify reality and are going to store the concept of reality in a geospatial data model, we need to understand the way in which spatial phenomenon are structured. There are two types of spatial phenomenon that we are going to discuss: discrete and continuous. |

|
|

|
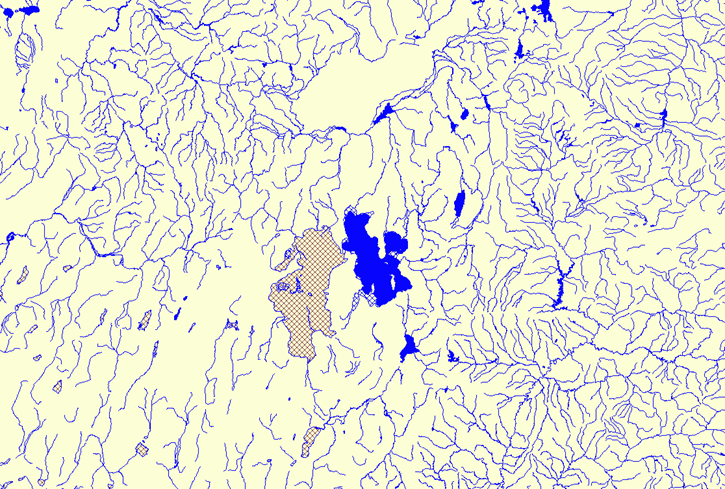
A discrete spatial phenomenon is anything that exists that is individually distinguishable. It has well-defined boundaries and it is easy to see where it begins and ends. It does not exist between where we observe it to be. For example, a stream or lake is very easy to tell where they begin and end and they are easily distinguishable individually on the Earth. The same thing goes for the roads. Roads have well-defined boundaries and are each easily distinguishable as individual roads.

|

|
A continuous spatial phenomenon is something that exists between our observations. It is data of a continuous nature that cannot be isolated as an individual. For instance, temperature is a continuous phenomenon that gently varies throughout space. A temperature reading at a single location does not represent a well-defined location where it is exactly that temperature. Instead, the temperature reading must be put in the context of the surrounding area as part of the larger "surface" of temperature readings; Temperatures should be considered as part of a larger continuous spatial phenomenon. Elevation is another example of a continuous spatial phenomenon. An elevation reading is only a single point in a larger surface.
|
Now that we know that we can store representations of discrete and continuous spatial phenomenon in geospatial data models, we should consider how we organize them. Typically, spatial phenomena are organized into separate geospatial data models by theme. Separating our models of reality will provide us with many benefits when it comes to querying and analysis.
Additionally, we tend to group things that are similar together in our minds, so we mirror that tendency in our geospatial data models. In the example on the screen, we have modeled five facets of Mexico: Cities (the top layer), water features, roads, state boundaries, and the national boundary. While we do separate the spatial phenomenon into separate geospatial data models in the computer, the reality is that often times these themes of data actually interact with each other in the real world. |

|
